


Levels of Detail for Asset Management
If you’ve spent any time around BIM, the concept of Level of Detail (LOD) will not be new to you. It’s the language we use to describe how much info a model contains at any given point in a project’s life. From a chunky LOD 100 massing block in early concept design through to an LOD 400 fabrication ready assembly with manufacturer-specific data baked in PS apologies I know I am very much using the US definition here.
It’s a brilliantly simple idea. As the LOD doesn’t just describe geometry, it describes the information attached to that geometry. The UK approach, captured neatly by NBS, went a step further and split it into two parallel tracks: LOD for the graphical/geometric content, and LOI (Level of Information) for the non-graphical data. The latest international standards (BS EN ISO 19650 and BS EN 17412-1) have evolved this into Level of Information Need, a more grown-up framing that starts with a much better question: what is the information actually going to be used for?
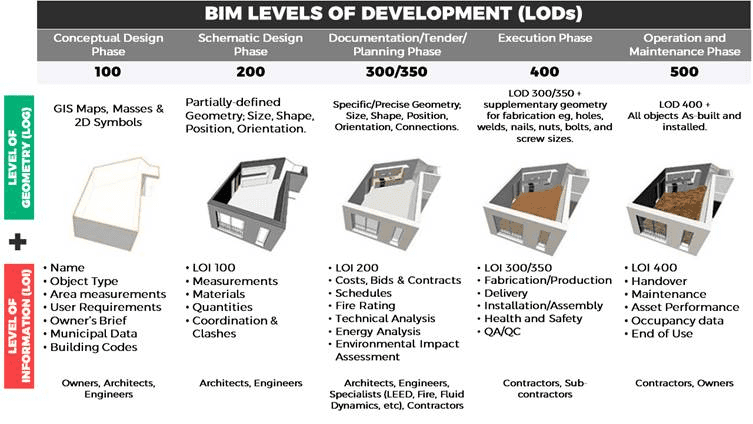
The old LOD (USA)Definition (its helpful when conveying my point 😊)
That question of what is the information for? is exactly the one I want to pick up here. Because, once you stop thinking about LOD as a design-stage concept and start thinking about it as a decision-stage concept, it becomes one of the most useful frameworks we have for digital twins in the asset management space and even more useful when we talk about decarbonising assets.
From design to operation: why LOD thinking belongs in asset management
Most of the conversAt OptimiseAI we work with clients like Lloyds Banking Group, Manchester Airports Group, ScotRail, Network Rail and Welsh Water on exactly this challenge: decarbonising real estates at scale. And what we’ve learned is that LOD thinking and phraseology borrowed and adapted from BIM, is the cleanest way to talk about what data you have got. PS Lets just start with making the most of the data you already have, when you need it, and what decisions it enables.
Here’s how it plays out in practice across three tiers.
Asset Management Tier 1 - Low LOD: the whole building and level
The truth about most UK building stock is that it’s information poor. A typical commercial or operational building has:
• one smart meter (sometimes two, if you’re lucky enough to have gas separately metered),
• a rough idea of when people are in the building,
• a building age and a property type,
• some idea of what heating and cooling kit is installed, and
• maybe (maybe) a floor plan in a filing cabinet.
That’s it. No BIM model. No granular sub-metering. No live BMS data flowing into a central platform.
If you wait until there is LOD 500 (old LOD money), for every project, you’ll wait forever. So, we don’t.
A Tier 1 digital twin in Predict is a low LOD twin made from exactly what most buildings already have: the whole-building geometry as a single envelope, the smart meter data feeding in live, and the basic asset attributes i.e. age, type, heating and cooling source, occupancy schedule, floor plans. From that starting point we can stand up a useful digital twin in seconds.
What does “useful” mean at this level? It means:
• live energy data for the building, contextualised against its physical and operational profile
• forecasted consumption and benchmarking against comparable assets
• a credible baseline you can plan interventions against
• the ability to repeat this exercise across a whole estate of buildings in a matter of days, not years
For an estate owner staring at a net zero target, that’s transformative. You get an estate-level digital twin that lets you plan your decarbonisation pathway, prioritise capital where it will have most impact, and then crucially it is measure, validate and optimise as you go. The twin is the spine that connects strategy to delivery.
The point worth labouring is this: Tier 1 isn’t a compromise. It’s the right LOD for the decision you’re making. If the question is “where should I focus my decarbonisation spend across 300 buildings?”, you don’t need a federated BIM model with manufacturer-specific FCU schedules. You need consistent, comparable, live data across the portfolio. Tier 1 delivers it.
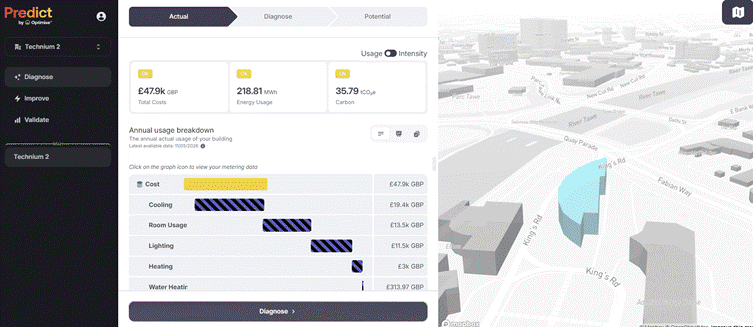
Example of Tier 1 – Building level with one smart meter. Whole Building digital twin with live insights.
Tier 2 - Mid LOD: into the building, room by room
The next step up happens when a building has sub-metering installed. Sub-metering changes the conversation because for the first time you can attribute energy consumption to specific parts of the building ie floors, wings, departments, plant rooms, individual systems.
That demands a corresponding step up in geometric LOD. The whole-building envelope from Tier 1 isn’t expressive enough anymore. So at Tier 2, the digital twin breaks the building down into the rooms and zones that the data is actually telling you about. Each metered zone gets its own geometry, its own data feed, its own attributes.
The result is room and zone-level insight: where is the energy actually going, which spaces are over-conditioned, which are running outside hours, which interventions will pay back fastest. This is the level at which operational tuning starts to deliver serious savings, often before you’ve spent a penny on capital works.
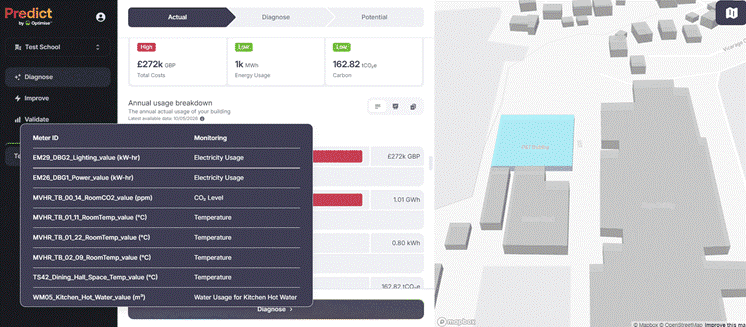
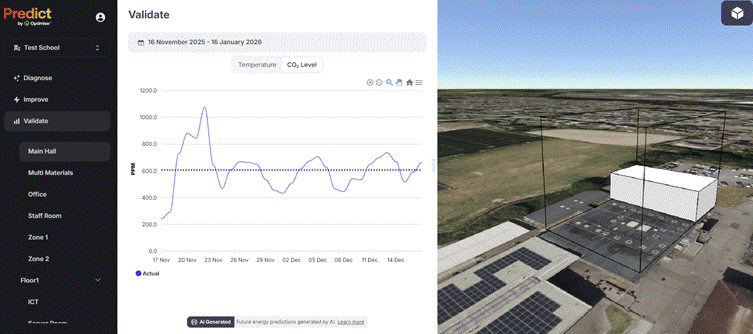
Tier 2 – More Granularity in regard to Sub Metering and Geometry
Tier 3 - High LOD: BIM, BMS and IoT in concert
The top tier is what most people think of when they hear “digital twin”, and it’s where the BIM world and the operations world finally meet. At Tier 3 we bring in:
• a BIM model providing rich geometric and asset data (effectively LOD 500 with operational extensions — what some call LOD 600 (sorry (not sorry) to keep using the old terminology),
• live data from the Building Management System (BMS) covering plant operation, setpoints and zone conditions,
• IoT sensor data filling in the gaps the BMS doesn’t see, such as occupancy, indoor environmental quality, equipment-level performance.
When all three layers are stitched together, you can do something genuinely new: dynamic, AI-driven optimisation of how the building runs in real time. Our work at Bristol Temple Meads is the clearest example of this in action a heritage station where high-resolution digital twin data is being used to optimise energy performance against the constraints of a listed building and a busy operational railway. That’s only possible at Tier 3.
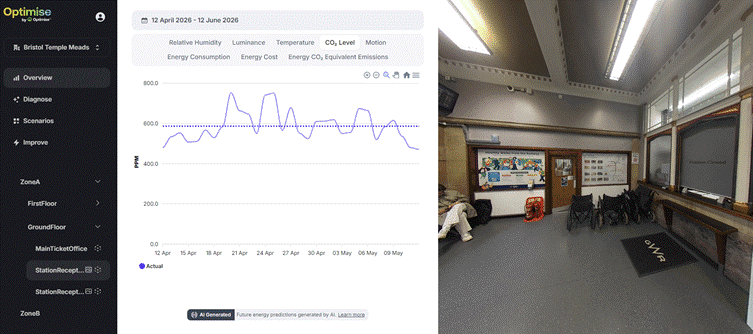
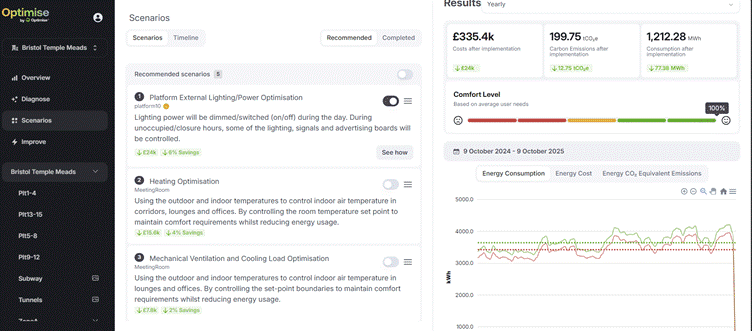
A High level of detail visually and information, which allows dynamic optimisation in real time
So what’s my point? stop waiting for perfect data, start with the right data
Bringing it back to the BIM analogy: nobody would seriously argue that you should refuse to do schematic design until you have LOD 400 models for every component. You’d never get off the ground. The whole point of LOD as a framework is that it gives you a structured way to match the information you have or can credibly get to the decision you’re trying to make.
The same logic needs to take hold in asset management and decarbonisation. The questions to ask are no longer “do we have a BIM model?” or “is this building fully sensored?”. They are:
• What decision am I trying to make?
• What LOD of digital twin is sufficient to make it?
• How do I get to that LOD as quickly and cheaply as possible across my whole estate?
For most owners, the answer at the estate level is Tier 1. For tuning operations in a key building, Tier 2. For the small number of strategically critical, complex or heritage assets where dynamic optimisation is the prize, Tier 3.
This is, in my view, a new way of looking at the information required to decarbonise the built environment. It borrows the discipline of BIM’s LOD framework, releases it from its design-stage cage, and reuses it where the real-world impact now sits ie in operating, maintaining and decarbonising the assets we already have.
That’s the lens we use at OptimiseAI, and it’s how Predict scales from a single smart meter to a whole-estate net zero programme, meeting each building, and each client, at the LOD they’re actually at today.
Chat to us
Copyright ©
2026
optimise-ai.com
Back to Blog
Levels of Detail for Asset Management
If you’ve spent any time around BIM, the concept of Level of Detail (LOD) will not be new to you. It’s the language we use to describe how much info a model contains at any given point in a project’s life. From a chunky LOD 100 massing block in early concept design through to an LOD 400 fabrication ready assembly with manufacturer-specific data baked in PS apologies I know I am very much using the US definition here.
It’s a brilliantly simple idea. As the LOD doesn’t just describe geometry, it describes the information attached to that geometry. The UK approach, captured neatly by NBS, went a step further and split it into two parallel tracks: LOD for the graphical/geometric content, and LOI (Level of Information) for the non-graphical data. The latest international standards (BS EN ISO 19650 and BS EN 17412-1) have evolved this into Level of Information Need, a more grown-up framing that starts with a much better question: what is the information actually going to be used for?
The old LOD (USA)Definition (its helpful when conveying my point 😊)
That question of what is the information for? is exactly the one I want to pick up here. Because, once you stop thinking about LOD as a design-stage concept and start thinking about it as a decision-stage concept, it becomes one of the most useful frameworks we have for digital twins in the asset management space and even more useful when we talk about decarbonising assets.
From design to operation: why LOD thinking belongs in asset management
Most of the conversAt OptimiseAI we work with clients like Lloyds Banking Group, Manchester Airports Group, ScotRail, Network Rail and Welsh Water on exactly this challenge: decarbonising real estates at scale. And what we’ve learned is that LOD thinking and phraseology borrowed and adapted from BIM, is the cleanest way to talk about what data you have got. PS Lets just start with making the most of the data you already have, when you need it, and what decisions it enables.
Here’s how it plays out in practice across three tiers.
Asset Management Tier 1 - Low LOD: the whole building and level
The truth about most UK building stock is that it’s information poor. A typical commercial or operational building has:
• one smart meter (sometimes two, if you’re lucky enough to have gas separately metered),
• a rough idea of when people are in the building,
• a building age and a property type,
• some idea of what heating and cooling kit is installed, and
• maybe (maybe) a floor plan in a filing cabinet.
That’s it. No BIM model. No granular sub-metering. No live BMS data flowing into a central platform.
If you wait until there is LOD 500 (old LOD money), for every project, you’ll wait forever. So, we don’t.
A Tier 1 digital twin in Predict is a low LOD twin made from exactly what most buildings already have: the whole-building geometry as a single envelope, the smart meter data feeding in live, and the basic asset attributes i.e. age, type, heating and cooling source, occupancy schedule, floor plans. From that starting point we can stand up a useful digital twin in seconds.
What does “useful” mean at this level? It means:
• live energy data for the building, contextualised against its physical and operational profile
• forecasted consumption and benchmarking against comparable assets
• a credible baseline you can plan interventions against
• the ability to repeat this exercise across a whole estate of buildings in a matter of days, not years
For an estate owner staring at a net zero target, that’s transformative. You get an estate-level digital twin that lets you plan your decarbonisation pathway, prioritise capital where it will have most impact, and then crucially it is measure, validate and optimise as you go. The twin is the spine that connects strategy to delivery.
The point worth labouring is this: Tier 1 isn’t a compromise. It’s the right LOD for the decision you’re making. If the question is “where should I focus my decarbonisation spend across 300 buildings?”, you don’t need a federated BIM model with manufacturer-specific FCU schedules. You need consistent, comparable, live data across the portfolio. Tier 1 delivers it.
Example of Tier 1 – Building level with one smart meter. Whole Building digital twin with live insights.
Tier 2 - Mid LOD: into the building, room by room
The next step up happens when a building has sub-metering installed. Sub-metering changes the conversation because for the first time you can attribute energy consumption to specific parts of the building ie floors, wings, departments, plant rooms, individual systems.
That demands a corresponding step up in geometric LOD. The whole-building envelope from Tier 1 isn’t expressive enough anymore. So at Tier 2, the digital twin breaks the building down into the rooms and zones that the data is actually telling you about. Each metered zone gets its own geometry, its own data feed, its own attributes.
The result is room and zone-level insight: where is the energy actually going, which spaces are over-conditioned, which are running outside hours, which interventions will pay back fastest. This is the level at which operational tuning starts to deliver serious savings, often before you’ve spent a penny on capital works.
Tier 2 – More Granularity in regard to Sub Metering and Geometry
Tier 3 - High LOD: BIM, BMS and IoT in concert
The top tier is what most people think of when they hear “digital twin”, and it’s where the BIM world and the operations world finally meet. At Tier 3 we bring in:
• a BIM model providing rich geometric and asset data (effectively LOD 500 with operational extensions — what some call LOD 600 (sorry (not sorry) to keep using the old terminology),
• live data from the Building Management System (BMS) covering plant operation, setpoints and zone conditions,
• IoT sensor data filling in the gaps the BMS doesn’t see, such as occupancy, indoor environmental quality, equipment-level performance.
When all three layers are stitched together, you can do something genuinely new: dynamic, AI-driven optimisation of how the building runs in real time. Our work at Bristol Temple Meads is the clearest example of this in action a heritage station where high-resolution digital twin data is being used to optimise energy performance against the constraints of a listed building and a busy operational railway. That’s only possible at Tier 3.
A High level of detail visually and information, which allows dynamic optimisation in real time
So what’s my point? stop waiting for perfect data, start with the right data
Bringing it back to the BIM analogy: nobody would seriously argue that you should refuse to do schematic design until you have LOD 400 models for every component. You’d never get off the ground. The whole point of LOD as a framework is that it gives you a structured way to match the information you have or can credibly get to the decision you’re trying to make.
The same logic needs to take hold in asset management and decarbonisation. The questions to ask are no longer “do we have a BIM model?” or “is this building fully sensored?”. They are:
• What decision am I trying to make?
• What LOD of digital twin is sufficient to make it?
• How do I get to that LOD as quickly and cheaply as possible across my whole estate?
For most owners, the answer at the estate level is Tier 1. For tuning operations in a key building, Tier 2. For the small number of strategically critical, complex or heritage assets where dynamic optimisation is the prize, Tier 3.
This is, in my view, a new way of looking at the information required to decarbonise the built environment. It borrows the discipline of BIM’s LOD framework, releases it from its design-stage cage, and reuses it where the real-world impact now sits ie in operating, maintaining and decarbonising the assets we already have.
That’s the lens we use at OptimiseAI, and it’s how Predict scales from a single smart meter to a whole-estate net zero programme, meeting each building, and each client, at the LOD they’re actually at today.
Copyright ©
2026
optimise-ai.com
Back to Blog
Levels of Detail for Asset Management
If you’ve spent any time around BIM, the concept of Level of Detail (LOD) will not be new to you. It’s the language we use to describe how much info a model contains at any given point in a project’s life. From a chunky LOD 100 massing block in early concept design through to an LOD 400 fabrication ready assembly with manufacturer-specific data baked in PS apologies I know I am very much using the US definition here.
It’s a brilliantly simple idea. As the LOD doesn’t just describe geometry, it describes the information attached to that geometry. The UK approach, captured neatly by NBS, went a step further and split it into two parallel tracks: LOD for the graphical/geometric content, and LOI (Level of Information) for the non-graphical data. The latest international standards (BS EN ISO 19650 and BS EN 17412-1) have evolved this into Level of Information Need, a more grown-up framing that starts with a much better question: what is the information actually going to be used for?
The old LOD (USA)Definition (its helpful when conveying my point 😊)
That question of what is the information for? is exactly the one I want to pick up here. Because, once you stop thinking about LOD as a design-stage concept and start thinking about it as a decision-stage concept, it becomes one of the most useful frameworks we have for digital twins in the asset management space and even more useful when we talk about decarbonising assets.
From design to operation: why LOD thinking belongs in asset management
Most of the conversAt OptimiseAI we work with clients like Lloyds Banking Group, Manchester Airports Group, ScotRail, Network Rail and Welsh Water on exactly this challenge: decarbonising real estates at scale. And what we’ve learned is that LOD thinking and phraseology borrowed and adapted from BIM, is the cleanest way to talk about what data you have got. PS Lets just start with making the most of the data you already have, when you need it, and what decisions it enables.
Here’s how it plays out in practice across three tiers.
Asset Management Tier 1 - Low LOD: the whole building and level
The truth about most UK building stock is that it’s information poor. A typical commercial or operational building has:
• one smart meter (sometimes two, if you’re lucky enough to have gas separately metered),
• a rough idea of when people are in the building,
• a building age and a property type,
• some idea of what heating and cooling kit is installed, and
• maybe (maybe) a floor plan in a filing cabinet.
That’s it. No BIM model. No granular sub-metering. No live BMS data flowing into a central platform.
If you wait until there is LOD 500 (old LOD money), for every project, you’ll wait forever. So, we don’t.
A Tier 1 digital twin in Predict is a low LOD twin made from exactly what most buildings already have: the whole-building geometry as a single envelope, the smart meter data feeding in live, and the basic asset attributes i.e. age, type, heating and cooling source, occupancy schedule, floor plans. From that starting point we can stand up a useful digital twin in seconds.
What does “useful” mean at this level? It means:
• live energy data for the building, contextualised against its physical and operational profile
• forecasted consumption and benchmarking against comparable assets
• a credible baseline you can plan interventions against
• the ability to repeat this exercise across a whole estate of buildings in a matter of days, not years
For an estate owner staring at a net zero target, that’s transformative. You get an estate-level digital twin that lets you plan your decarbonisation pathway, prioritise capital where it will have most impact, and then crucially it is measure, validate and optimise as you go. The twin is the spine that connects strategy to delivery.
The point worth labouring is this: Tier 1 isn’t a compromise. It’s the right LOD for the decision you’re making. If the question is “where should I focus my decarbonisation spend across 300 buildings?”, you don’t need a federated BIM model with manufacturer-specific FCU schedules. You need consistent, comparable, live data across the portfolio. Tier 1 delivers it.
Example of Tier 1 – Building level with one smart meter. Whole Building digital twin with live insights.
Tier 2 - Mid LOD: into the building, room by room
The next step up happens when a building has sub-metering installed. Sub-metering changes the conversation because for the first time you can attribute energy consumption to specific parts of the building ie floors, wings, departments, plant rooms, individual systems.
That demands a corresponding step up in geometric LOD. The whole-building envelope from Tier 1 isn’t expressive enough anymore. So at Tier 2, the digital twin breaks the building down into the rooms and zones that the data is actually telling you about. Each metered zone gets its own geometry, its own data feed, its own attributes.
The result is room and zone-level insight: where is the energy actually going, which spaces are over-conditioned, which are running outside hours, which interventions will pay back fastest. This is the level at which operational tuning starts to deliver serious savings, often before you’ve spent a penny on capital works.
Tier 2 – More Granularity in regard to Sub Metering and Geometry
Tier 3 - High LOD: BIM, BMS and IoT in concert
The top tier is what most people think of when they hear “digital twin”, and it’s where the BIM world and the operations world finally meet. At Tier 3 we bring in:
• a BIM model providing rich geometric and asset data (effectively LOD 500 with operational extensions — what some call LOD 600 (sorry (not sorry) to keep using the old terminology),
• live data from the Building Management System (BMS) covering plant operation, setpoints and zone conditions,
• IoT sensor data filling in the gaps the BMS doesn’t see, such as occupancy, indoor environmental quality, equipment-level performance.
When all three layers are stitched together, you can do something genuinely new: dynamic, AI-driven optimisation of how the building runs in real time. Our work at Bristol Temple Meads is the clearest example of this in action a heritage station where high-resolution digital twin data is being used to optimise energy performance against the constraints of a listed building and a busy operational railway. That’s only possible at Tier 3.
A High level of detail visually and information, which allows dynamic optimisation in real time
So what’s my point? stop waiting for perfect data, start with the right data
Bringing it back to the BIM analogy: nobody would seriously argue that you should refuse to do schematic design until you have LOD 400 models for every component. You’d never get off the ground. The whole point of LOD as a framework is that it gives you a structured way to match the information you have or can credibly get to the decision you’re trying to make.
The same logic needs to take hold in asset management and decarbonisation. The questions to ask are no longer “do we have a BIM model?” or “is this building fully sensored?”. They are:
• What decision am I trying to make?
• What LOD of digital twin is sufficient to make it?
• How do I get to that LOD as quickly and cheaply as possible across my whole estate?
For most owners, the answer at the estate level is Tier 1. For tuning operations in a key building, Tier 2. For the small number of strategically critical, complex or heritage assets where dynamic optimisation is the prize, Tier 3.
This is, in my view, a new way of looking at the information required to decarbonise the built environment. It borrows the discipline of BIM’s LOD framework, releases it from its design-stage cage, and reuses it where the real-world impact now sits ie in operating, maintaining and decarbonising the assets we already have.
That’s the lens we use at OptimiseAI, and it’s how Predict scales from a single smart meter to a whole-estate net zero programme, meeting each building, and each client, at the LOD they’re actually at today.
Copyright ©
2026
optimise-ai.com